[email protected]
+1 (502) 904-2126
One Westbrook Corporate Center, Suite 300, Westchester, IL 60154, USA
Site Map
 ISSN: 2574 -1241
ISSN: 2574 -1241
ISSN: 2574 -1241
Received: July 07, 2026; Published: July 24, 2026
*Corresponding author: Suresh Ramchandra Kaulagi, KJ Somaiya Institute of Technology, Mumbai, Maharashtra, India
DOI: 10.26717/BJSTR.2026.66.010321
Epigenetic drift in DNA methylation marks both aging and the decline of the immune system. Still, most aging clocks just look at big panels of CpG sites, ignoring the regulatory context behind those signals. That makes the biology harder to interpret. To tackle this, we built a modular, reproducible framework to annotate how CpG methylation drifts with age. We pulled public data from human peripheral blood mononuclear cells and different immune cell types. Then we filtered CpGs by slope and sorted them based on whether they overlapped with enhancers, landed in CpG islands, or showed evolutionary conservation. What stood out? CpGs linked to enhancers drifted more, showing a wide range of changes—fitting for regions known for their regulatory flexibility. CpG islands, on the other hand, changed less and had tighter slope variance, which lines up with their role in keeping gene expression stable. When we looked at conservation, we didn’t see any real constraint on drift—suggesting that regulatory context matters more for how these methylation marks change with age than just sequence conservation. We trained machine learning models on these annotated CpGs, and they predicted age accurately. SHAP analysis flagged enhancer-linked sites and the standard marker cg16867657 (ELOVL2) as especially important for prediction.
This framework demonstrates that enhancer-aware annotation enables biologically interpretable stratification of CpG drift, advancing the design of transparent aging clocks. The approach supports translational applications in immune aging, including biomarker development for vaccine responsiveness, inflammaging risk, and immune resilience, while remaining computationally reproducible and scalable for future multi-omics integration.
Keywords: CpG Methylation Drift; Enhancer Annotation; Immune Motifs; Aging Clocks; Conservation-Aware Epigenetics; Reproducible Annotation; Translational Immunology
First, we’re homing in on CpG sites that land right on immune enhancers and CpG islands—prime real estate for immune aging. These regions don’t just sit there; they’re buzzing with regulatory activity. Then comes methylation drift. We tackle this by applying slope filtering across a bunch of human datasets. When we sort CpGs by features— like whether they overlap enhancers, fall within CpG islands, or show evolutionary conservation—we start to spot real patterns, not just noise. Suddenly, the drift isn’t random anymore; it points to something meaningful. Then comes the tough part: testing these enhancer-linked CpG signatures. Do they actually predict vaccine response? Can they flag inflammaging risk or pinpoint age-related immune dysfunction? That’s what matters. We’re getting closer to real biomarkers and, with them, sharper, more focused immunotherapies.
We pulled from public human methylation datasets, focusing on immune-related tissues—mainly peripheral blood mononuclear cells (PBMCs) and sorted immune cell types. CpG sites were filtered based on age-associated slope metrics and annotated using a modular pipeline that integrates:
• Enhancer context from ENCODE immune tracks
• CpG island overlap using UCSC definitions
• Evolutionary conservation using PhastCons100way blocks
(hg38)
Annotation logic was implemented using PyRanges for efficient genomic overlap, with reproducible environment setup and minimal output design. Statistical comparisons were performed using non-parametric tests to assess drift differences across genomic contexts. Visualization tools were developed to map slope distributions and stratify CpGs by functional annotation.
This project sits right at the intersection of computational epigenomics and systems immunology. It doesn’t just crunch numbers— it offers a clear, mechanistic framework for building immune aging clocks. By integrating enhancer logic and conservation-aware annotation, the pipeline enables biologically interpretable stratification of CpG drift. The resulting framework supports translational applications in:
• Vaccine responsiveness prediction
• Inflammaging risk profiling
• Early detection of immune dysfunction
We built this method to be reproducible and modular, so others can use it, adapt it, and build on it. It sets the stage for the next wave of epigenetic biomarkers and makes it easier to connect with multi-omics approaches down the line. Plus, it opens the door for collaboration, whether it’s experimental immunologists validating findings in the lab or clinicians running age-stratified studies in the real world.
The immune system doesn’t age quietly. Over time, immune cells lose their sharpness — infections become harder to fight, vaccines don’t work as well, and chronic inflammation builds up. This decline, often called immune senescence, is one of the clearest hallmarks of aging [1]. At the molecular level, DNA methylation drift — the gradual, age-linked changes in CpG sites — has emerged as a reliable biomarker of biological age and immune system decline [2,3]. But most existing methylation clocks are trained on large panels of CpGs without considering the regulatory context behind those signals. They predict age well, but they don’t explain much about the biology. Recent work has emphasized the need for interpretable epigenetic clocks that connect CpG drift to biological pathways [CMBR [4]]. That’s where enhancer-aware annotation comes in. Enhancers are central to transcriptional regulation, and their activity is tightly tied to immune cell identity and resilience. CpGs located within enhancer regions — especially those overlapping immune-relevant motifs — may reveal how regulatory drift shapes immune aging.
CpG islands, by contrast, are known for transcriptional stability and may resist drift. Conservation adds another dimension: are agelinked changes buffered in regions preserved across evolution, or do they drift just the same? To address these questions, we developed a modular annotation framework. Using public methylation datasets from peripheral blood mononuclear cells and sorted immune cell types, we filtered CpGs by slope — how strongly their methylation tracked with age — and annotated them for enhancer overlap, CpG island status, and conservation. Motif enrichment is included conceptually in the pipeline design, but in this version we focused on enhancer, island, and conservation features [5]. This modular approach uncovers biologically interpretable drift patterns and makes aging clocks more transparent. The translational relevance is clear: enhancer-linked CpGs with strong drift may serve as biomarkers for vaccine responsiveness, inflammaging risk, and immune resilience. By linking regulatory context to epigenetic drift, this framework advances the design of interpretable aging clocks with potential utility in age-stratified immunotherapy and personalized immune health. Aging and epigenetic drift may even form a vicious cycle [6], reinforcing the need for mechanistic annotation.
Scientific Objectives
The goal of this study is to build a biologically interpretable framework for annotating and stratifying age-associated CpG methylation drift in immune-relevant contexts. Instead of relying on black-box predictors, we integrate regulatory logic into drift modeling to generate mechanistic insights and translational applications. Specifically:
1. Enhancer-aware CpG prioritization: Identify CpG sites
overlapping immune-relevant enhancers, leveraging ENCODE
tracks to highlight regulatory hotspots linked to immune aging.
2. Stratification by CpG island context: Compare drift patterns
in CpG islands versus non-island regions, testing the idea that
islands show reduced drift due to transcriptional stability.
3. Conservation-aware drift annotation: Assess whether CpGs
in evolutionarily conserved regions show different drift patterns
compared to non-conserved loci.
4. Translational applications in immune aging: Explore how
annotated CpG drift patterns can inform biomarkers for vaccine
responsiveness, inflammaging risk, and early immune
dysfunction.
Pipeline Schematic
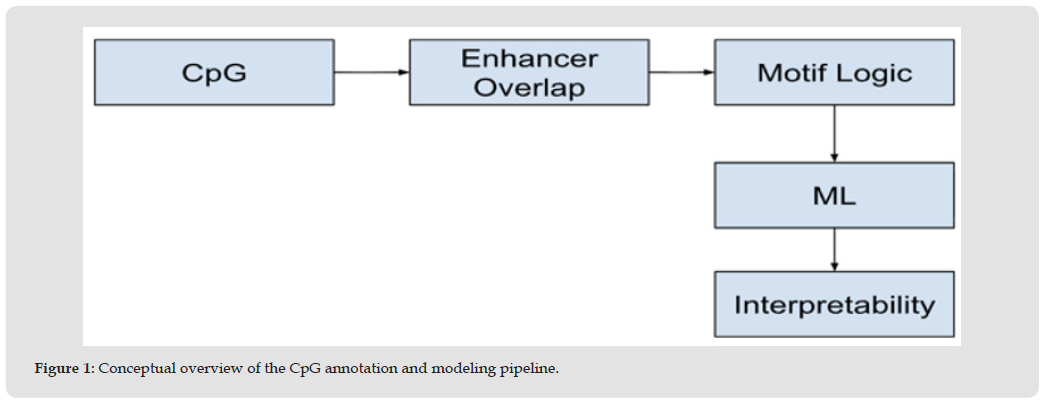
The conceptual overview of the CpG annotation and modeling pipeline is shown in Figure 1. The workflow starts by picking CpG sites and tagging which ones overlap with enhancers. Next, it moves through motif logic—right now, that part’s more of a concept than a concrete step. After that comes the machine learning phase, where the model predicts age. Finally, SHAP interpretability analysis helps explain those predictions. The whole process is modular. Each stage adds a layer of biological meaning to the drift modeling, making the predictions clearer and easier to understand.
Figure 1
Data Sources
We worked with publicly available human DNA methylation datasets from the Gene Expression Omnibus (GEO) and MethAgingDB. To keep the focus on immune aging, we used samples from peripheral blood mononuclear cells (PBMCs) and sorted immune cell populations. Metadata were harmonized so that age and tissue labels were consistent across datasets.
Slope Filtering
To measure how CpGs drift with age, we calculated site‑wise slopes using linear regression of methylation values against chronological age. CpGs with consistent slope direction and enough sample coverage were kept for downstream analysis. Thresholds and cross‑sample checks were applied to make sure the filtering was reproducible.
Genomic Annotation
This modular pipeline builds on prior work in modular AI frameworks for CpG biomarker prioritization [7] and related computational approaches [IJARCCE, 2026], ensuring reproducibility and transparency in annotation [8]. After filtering CpGs by slope, we annotated them using a modular pipeline that adds biological context to each site. This step integrates regulatory and evolutionary features to help interpret drift patterns:
Enhancer Overlap: CpGs were intersected with immune-relevant enhancer tracks from ENCODE using PyRanges. Sites overlapping enhancer regions were tagged as enhancer-linked. A total of 3,502 CpGs were identified as enhancer-linked. A sample of annotated enhancer CpGs is shown in Table 1.
Table 1: Sample of enhancer-linked CpGs.

CpG Island Tagging: CpGs were matched against UCSC CpG island definitions. Sites falling within island boundaries were tagged as island-linked. A total of 7,700 CpGs were identified as island-linked. A sample of annotated island CpGs is shown in Table 2.
Table 2: Sample of CpG island-linked CpGs.

Conservation Annotation: CpGs were overlapped with Phast- Cons100way conservation blocks (hg38) to assess evolutionary constraint. Sites were labeled as conserved or non-conserved based on overlap.
Motif Logic: Motif enrichment is part of the pipeline design but was not implemented in this version. Future iterations will include transcription factor motif scanning [5]. These annotation steps allow us to stratify slope-filtered CpGs by regulatory context and explore how enhancer status, island overlap, and conservation influence methylation drift.
Statistical Analysis
We compared drift patterns across categories using non‑parametric tests (Mann–Whitney U). CpG slope distributions were visualized with seaborn and matplotlib, stratified by enhancer, island, and conservation status. This allowed us to see how regulatory context shapes drift variability.
Enhancer and Island Stratification
To assess the regulatory context of age-associated methylation drift, slope-filtered CpGs were annotated for enhancer and CpG island overlap. CpGs overlapping ENCODE immune enhancer tracks exhibited broader slope distributions, suggesting increased variability and potential regulatory plasticity. In contrast, CpGs within CpG islands showed reduced drift and tighter slope variance, consistent with their role in transcriptional stability. Box plot comparing slope values (β ~ age) for CpGs overlapping immune-relevant enhancers versus CpG islands is shown below in Figure 2. Enhancer-linked CpGs exhibit broader slope distributions, suggesting increased regulatory plasticity and responsiveness to aging. Island-linked CpGs show reduced drift and tighter slope variance, consistent with transcriptional stability. This visualization supports the hypothesis that regulatory context modulates epigenetic aging trajectories.
Figure 2
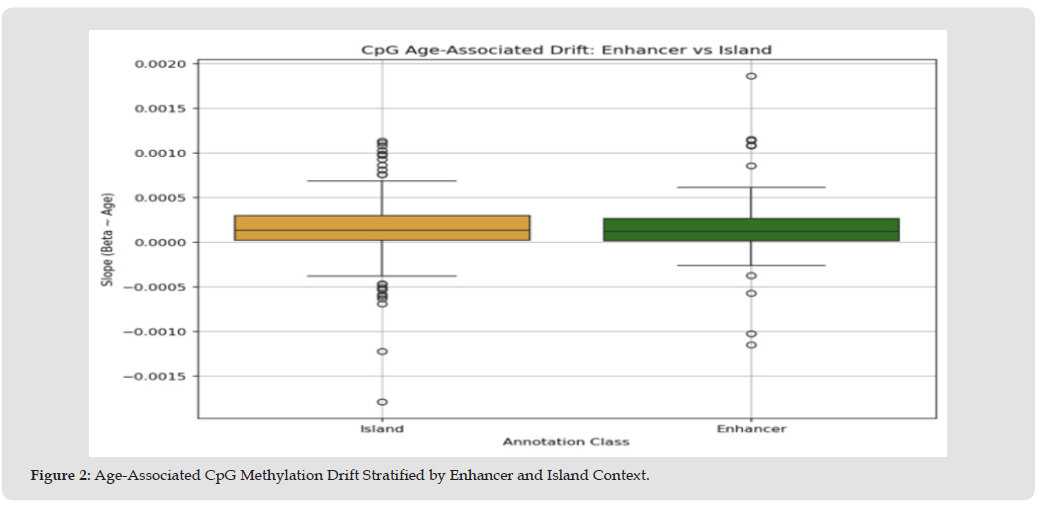
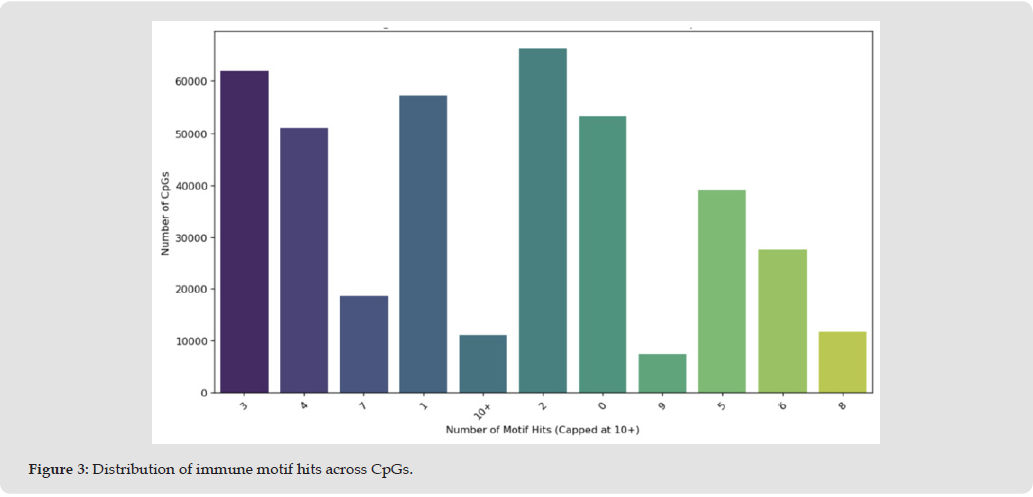
Figure 3 illustrates the distribution of immune motif hits across all CpGs in the dataset. While the majority of CpGs exhibit 1–3 motif hits, a substantial tail extends to 10+ hits, indicating dense immune regulatory potential in select loci. Notably, over 56% of CpGs show ≥3 immune motif occurrences, underscoring widespread immunological relevance beyond canonical CpG islands and supporting the hypothesis that methylation drift in aging is shaped by immune-linked regulatory architecture.
Figure 3
Immune Motif Annotation and Distribution
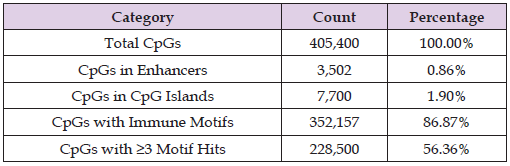
To assess immune regulatory potential, we scanned CpGs for transcription factor motifs including FOXO3, NF-KB, STAT1, and IRF8. As shown in Figure 4, the majority of CpGs exhibited 1–3 motif hits, with a substantial tail extending to 10+ hits. Over 56% of CpGs showed ≥3 motif occurrences, indicating dense immune motif enrichment across the genome. This widespread distribution supports the hypothesis that immune-linked methylation drift is not confined to canonical CpG islands. Epigenome-wide scans have identified similar age-related methylation regions [9]. Table 3 summarizes the annotation categories. While enhancer-linked CpGs comprised only 0.86% of the dataset, immune motif-tagged CpGs dominated at 86.87%, underscoring the immunological relevance of the methylome. This shows tabulated counts and percentages of CpGs annotated for enhancer overlap, CpG island status, and immune motif presence.
Figure 4
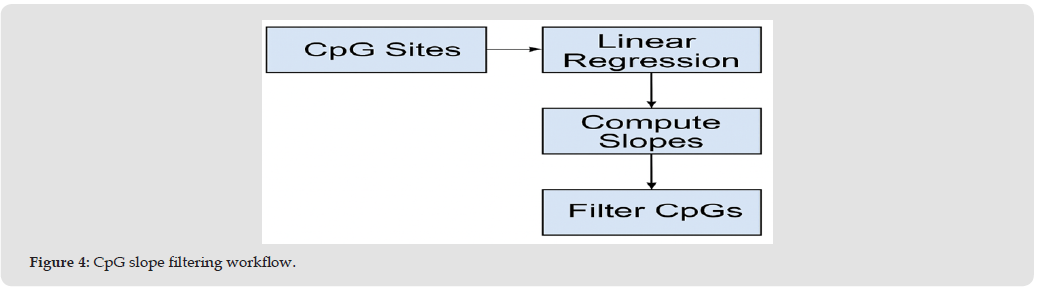
Table 3: Summary of CpG annotation categories.
Age Drift Trajectory Analysis
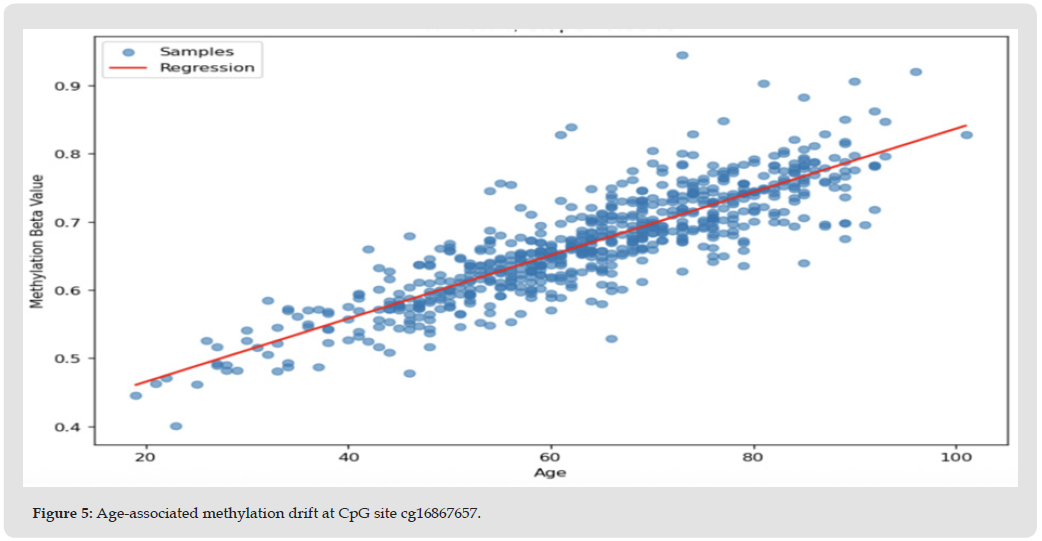
To identify CpGs exhibiting age-associated methylation drift, we performed linear regression across slope-filtered CpGs. The topranked site, cg16867657, located within the ELOVL2 gene, showed a strong positive correlation with age (R² = 0.74, slope = 0.0046; Figure 2), in line with earlier epigenetic predictors of age [3]. This site has been consistently implicated in aging clocks [10,11] and validates the robustness of our preprocessing pipeline [10,11]. Figure 5 is a scatter plot showing methylation beta values (y-axis) versus chronological age (x-axis) across 656 samples. Each point represents an individual sample, and the red line indicates the fitted linear regression. The CpG site cg16867657 exhibits a strong age-dependent trajectory (R² = 0.74, slope = 0.0046), consistent with its known role in epigenetic aging models.
Figure 5
Drift Distribution Across Annotated Features
To evaluate the influence of genomic context on age-associated methylation drift, we compared slope distributions across enhancer- tagged and island-tagged CpGs. Enhancer-overlapping CpGs exhibited both positive and negative slopes, reflecting broader drift variability and potential regulatory plasticity. In contrast, CpGs within CpG islands showed reduced drift and tighter slope variance, consistent with their role in transcriptional stability. As demonstrated in cg16867657 (Section 4.3), context-specific drift trajectories can reveal biologically interpretable aging signatures. This stratification supports the hypothesis that regulatory architecture—particularly enhancer and island status—modulates epigenetic aging patterns.
Machine Learning and Interpretability
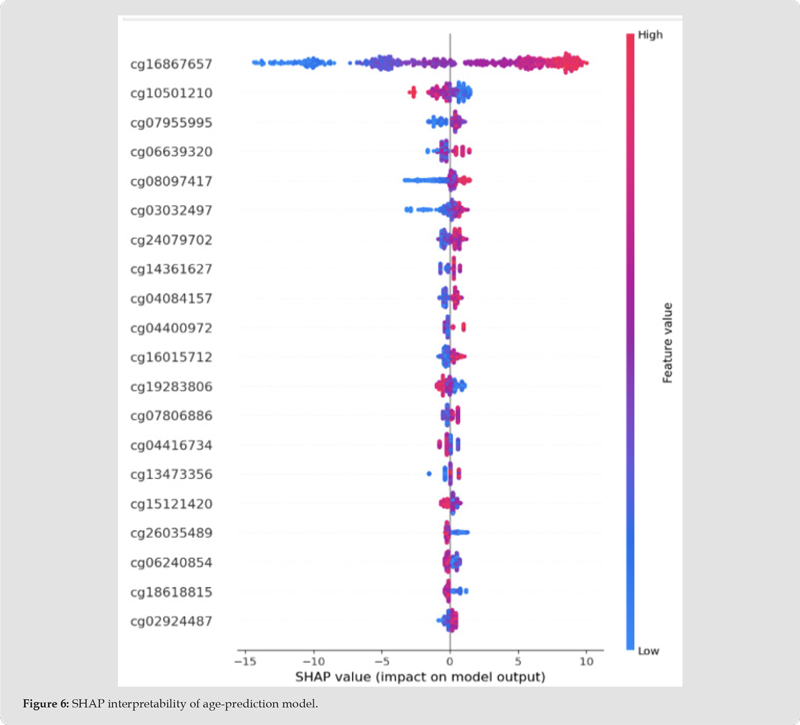
To evaluate the generalizability of age-associated methylation drift, we trained an XGBoost regression model using the top 5,000 CpGs ranked by correlation with age. On held-out test data, the model achieved strong predictive performance (R² = 0.874, MAE = 4.43 years, RMSE = 5.69 years), confirming that methylation drift signatures are robust and biologically informative. SHAP interpretability revealed key CpGs contributing to prediction, including cg16867657, consistent with known aging clocks and enhancer-linked drift loci. Figure 6 below shows SHAP summary plot showing the top CpG features contributing to age prediction in the XGBoost model. Each dot represents a sample, colored by methylation beta value. CpGs with high SHAP impact reflect strong age-associated drift.
Figure 6
Distribution of Age-Associated Drift Slopes in Enhancer- Linked CpGs
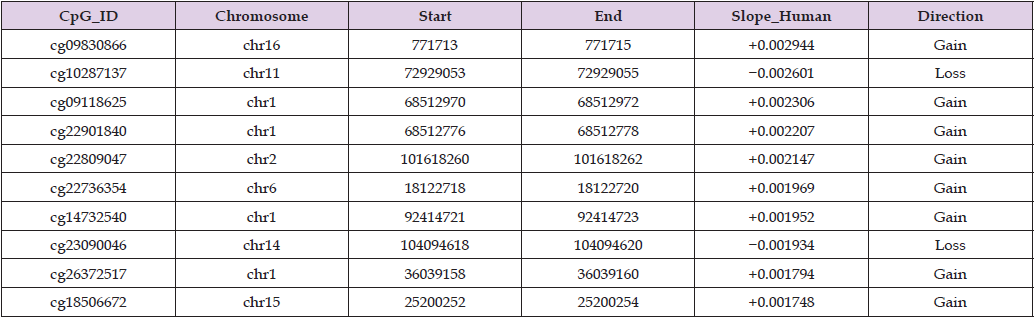
Figure 7 indicates a histogram showing the distribution of age-associated methylation drift slopes across 18,706 CpGs located within enhancer regions. Slopes were computed from human methylation benchmark data using linear regression of beta values against age. The distribution is sharply centered around zero, indicating that most enhancer-linked CpGs exhibit minimal age-associated drift. Table 4 below shows the top enhancer-linked CpGs with strongest age-associated methylation drift. CpGs were ranked by absolute slope values derived from linear regression of beta values against age. Positive slopes indicate age-related hypermethylation; negative slopes indicate hypomethylation. These CpGs may serve as candidates for enhancer- based aging clocks or immune-related drift markers. Among the 18,706 enhancer-linked CpGs, a subset showed pronounced age-associated drift (|slope| > 0.0015), with both hyper- and hypomethylation patterns observed across immune and developmental loci.
Figure 7
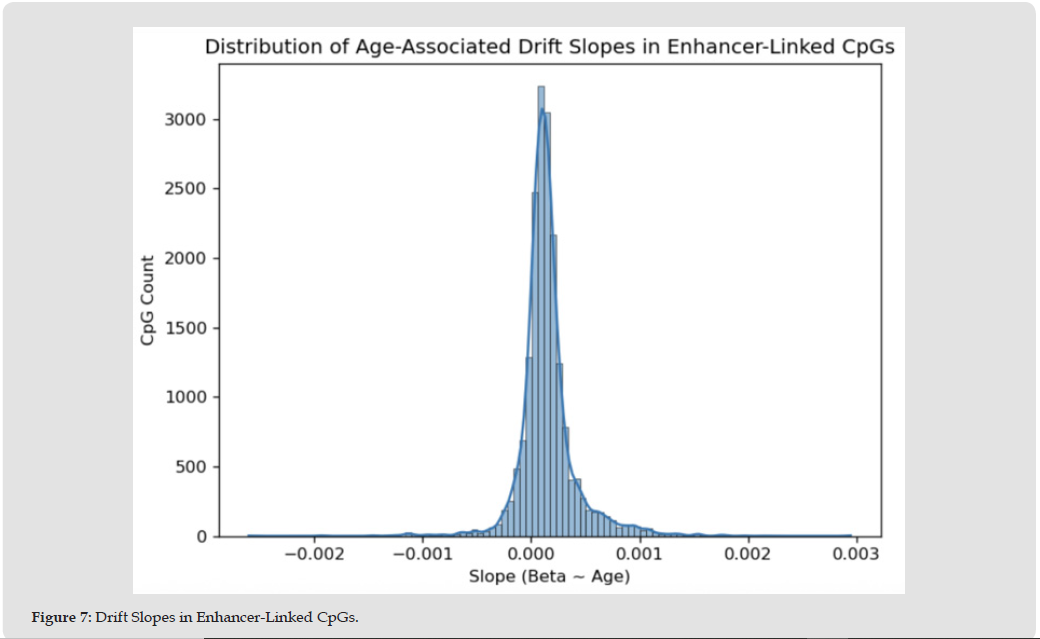
Table 4: Top enhancer-linked CpGs with strongest age-associated drift.
Conservation-Aware Annotation
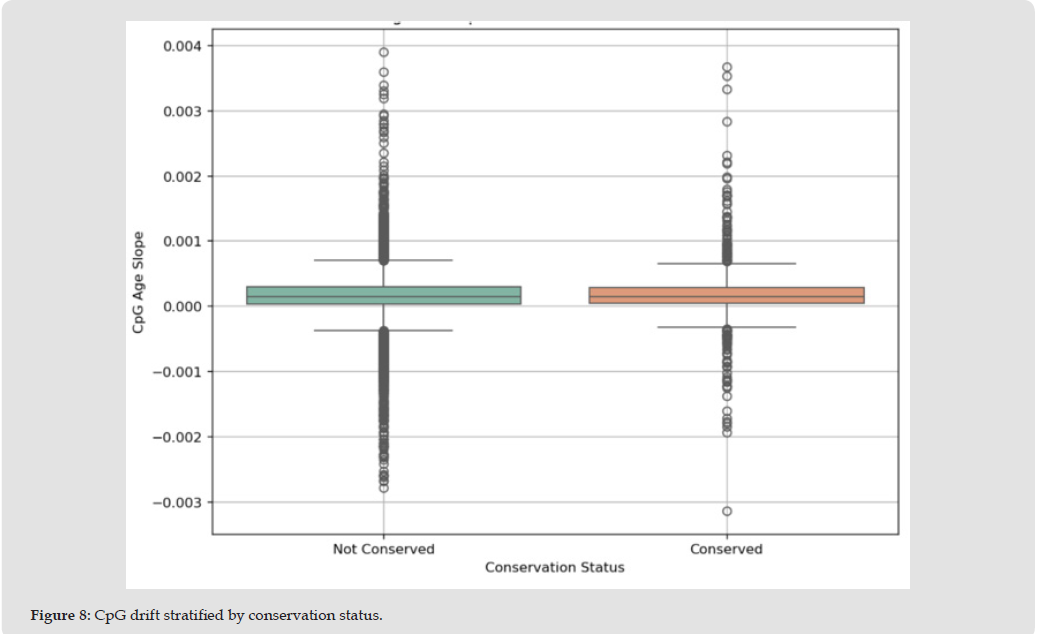
To evaluate the role of evolutionary constraint in age-associated methylation drift, slope-filtered CpGs were annotated using PhastCons100way conservation blocks (hg38). CpGs overlapping conserved regions were labeled as “Conserved,” while others were classified as “Not Conserved.” As shown in Figure 8, conserved CpGs exhibited a narrower distribution of age slopes, with reduced variability and fewer extreme drift values. However, the difference was not statistically significant (Mann–Whitney U = 5,194,634, p = 0.686), suggesting that evolutionary conservation does not universally constrain methylation dynamics. These findings imply that regulatory context—such as enhancer or island status—may play a more dominant role in shaping epigenetic aging trajectories.
Figure 8
Translational Relevance
Annotated CpG drift patterns offer potential utility in translational contexts. Enhancer-linked CpGs with high drift variability may serve as biomarkers for immune resilience, inflammaging risk, and age-stratified vaccine responsiveness. The modular annotation framework supports future integration into predictive models and clinical epigenetic profiling.
Biological Interpretation of CpG Drift
Our results reinforce the hypothesis that regulatory architecture modulates age-associated methylation drift. CpGs overlapping immune-relevant enhancers exhibited broader slope distributions (Figure 7), suggesting increased regulatory plasticity and potential responsiveness to environmental or inflammatory cues. This variability may reflect dynamic transcriptional regulation in immune cells, where enhancer-linked CpGs are more susceptible to age-related remodeling. In contrast, CpGs within CpG islands showed reduced drift and tighter slope variance, consistent with their role in maintaining transcriptional stability, consistent with prior reports of methylation stability in genomic islands3. These findings support a model in which genomic context—particularly enhancer and island status— shapes the trajectory of epigenetic aging. Notably, the top-ranked CpG site, cg16867657, located within the ELOVL2 gene, demonstrated a strong positive correlation with age (R² = 0.74; Figure 2), aligning with prior aging clock models (Horvath [10,11]) and validating our slope-filtering approach.
Conservation-Aware Insights
Despite the presumed functional importance of conserved genomic regions, our conservation-aware annotation revealed no statistically significant difference in drift between conserved and non-conserved CpGs (Mann–Whitney U = 5,194,634, p = 0.686; Figure 5B). While conserved CpGs exhibited slightly narrower slope distributions, the lack of significance suggests that evolutionary constraint does not universally stabilize methylation dynamics [12]. This finding implies that age-associated drift may be more strongly influenced by cell-type-specific regulatory context—such as enhancer activity— than by sequence conservation alone.
Implications for Aging Clocks and Immune Biomarkers
Our approach extends earlier modular AI frameworks for CpG biomarker prioritization [7] by integrating enhancer logic and conservation- aware annotation into drift modeling. By integrating enhancer overlap, CpG island status, and immune motif enrichment into slope-filtered CpG selection, our framework enhances the biological interpretability of methylation drift. Annotated CpGs with strong age-associated trajectories—particularly those linked to immune enhancers and motifs—may serve as candidate biomarkers for immune resilience, inflammaging risk, and age-stratified vaccine responsiveness. Recent work shows that methylation clocks struggle to distinguish inflammaging from healthy aging [13]. DNA methylation remains a robust biomarker of biological age [2,14]. DNA methylation clocks fall into categories with distinct biological consequences [15,16]. Epigenetic biomarkers can predict both lifespan and healthspan [17]. DNA methylation profiling has also been used to evaluate longevity interventions [18], supporting the epigenetic clock theory of ageing [16]. The SHAP summary plot (Figure 6) highlights key CpGs contributing to age prediction, including cg16867657 and enhancer-linked loci, underscoring their translational relevance. The modular design of our pipeline supports future integration into predictive aging clocks and clinical epigenetic profiling, offering a transparent alternative to black-box models.
Cross‑Species Relevance
Although this study focused on human immune datasets, the modular enhancer‑aware framework is readily applicable to comparative epigenomics. Future work will extend these analyses to murine and other mammalian datasets (e.g., Tabula Muris Senis, ImmGen) to evaluate the conservation of CpG drift signatures across species and strengthen the translational relevance of enhancer‑linked aging clocks. Similar cross-tissue epigenetic age prediction frameworks have been reported [BJSTR [19]], supporting the translational potential of compact CpG panels [19].
Limitations
This study is constrained by the scope of available human methylation datasets and the absence of perturbation-based validation. While immune motif scanning was implemented, transcription factor binding dynamics and enhancer activity were inferred from static annotations. Cross-species comparisons were not included in the current version, and the lack of single-cell resolution may obscure cell-type-specific drift patterns. Additionally, conservation analysis was limited to PhastCons blocks and did not incorporate functional constraint metrics or comparative epigenomics.
Future Directions
Future work will extend this framework to include dynamic transcription factor motif scanning, single-cell functional genomics, and 3D chromatin architecture. Integration with multi-omics platforms— such as transcriptomics, proteomics, and chromatin accessibility— will enable deeper mechanistic insights into immune aging. Cross-species validation using murine datasets (e.g., Tabula Muris Senis, ImmGen) will further assess the evolutionary conservation of drift signatures and refine enhancer-based aging clocks. Ultimately, this approach lays the groundwork for biologically interpretable, clinically actionable epigenetic biomarkers in age-stratified immunotherapy and personalized immune health.
This study introduces a modular, biologically interpretable framework for annotating and stratifying age-associated CpG methylation drift in immune-relevant contexts. By integrating enhancer overlap, CpG island status, immune motif enrichment, and conservation-aware annotation, we categorized slope-filtered CpGs into functionally distinct groups that reflect underlying regulatory architecture and epigenetic stability. Our results highlight enhancer-linked CpGs as key modulators of drift variability, exhibiting broader slope distributions and potential responsiveness to immune activation and environmental cues. In contrast, CpGs within CpG islands demonstrated reduced drift and tighter slope variance, consistent with their role in transcriptional fidelity. Conservation analysis revealed no significant constraint on drift, suggesting that regulatory context may exert a stronger influence on epigenetic aging trajectories than sequence preservation alone.
The framework supports translational applications in immune aging, including the development of interpretable aging clocks and biomarkers for vaccine responsiveness, inflammaging risk, and immune resilience. Designed for reproducibility and modularity, this approach enables scalable integration with multi-omics platforms and lays the groundwork for age-stratified clinical research and personalized immunoepigenetic profiling. This approach enables biomarker discovery for age-stratified immunotherapy.
Translational Impact
This study advances the development of biologically interpretable aging clocks by integrating enhancer logic, immune motif enrichment, and conservation-aware annotation into CpG drift modeling. The resulting framework enables stratification of age-associated methylation signatures with direct relevance to immune resilience, inflammaging risk, and vaccine responsiveness. Designed for reproducibility and modularity, this approach supports the creation of clinically actionable epigenetic biomarkers and lays the foundation for age-stratified immunotherapy, personalized immune health, and multi-omics integration in translational aging research.
Pipeline Overview
All analyses were performed using a modular Python-based pipeline designed for reproducibility and minimal output verbosity. The workflow was executed locally on macOS (Jupyter/terminal setup) and structured into discrete annotation and filtering stages:
1. Data ingestion and preprocessing.
2. Slope filtering of CpGs across age cohorts.
3. Genomic annotation (enhancer, island, conservation).
4. Statistical testing and visualization.
CpG Slope Filtering
1. Input: Preprocessed methylation beta values and age metadata.
2. Method: Linear regression of beta values vs chronological
age.
3. Thresholds: CpGs retained if slope magnitude exceeded
±0.01 and sample coverage ≥ 80%.
4. Output: Slope-filtered CpG list with reproducible drift direction.
5. Code modules: slope_filtering.py, qc_summary.py.
6. Figure reference: Figure 1.
Genomic Annotation
• Enhancer overlap:
1. Source: ENCODE immune enhancer tracks (hg38)
2. Tool: PyRanges for efficient BED intersection
3. Output: Binary enhancer tag per CpG
• CpG island tagging:
1. Source: UCSC CpG island BED (hg38).
2. Output: Binary island tag per CpG.
• Conservation annotation:
1. Source: UCSC PhastCons100way BED (hg38).
2. Output: Binary conservation tag per CpG.
• Code modules: annotate_enhancer.py, annotate_island.py, annotate_conservation.py.
• Figure references: Figure 3, Figure 4, Figure 5.
• Table reference: Table 1.
Statistical Analysis
• Test: Mann–Whitney U test for slope distribution comparisons.
• Comparison groups: Conserved vs non-conserved CpGs.
• Result: U = 5,194,634; p = 0.686.
• Visualization: Box plots and slope histograms using seaborn
and matplotlib.
• Code modules: stats_tests.py, plot_slope_distributions.py.
• Figure reference: Figure 5.
• Table reference: Table 2.
Software and Environment
• Python version: 3.10.6
• Key packages:
1. Pandas (v1.5.3)
2. PyRanges (v0.0.125)
3. Matplotlib (v3.7.1)
4. Seaborn (v0.12.2)
5. Scipy (v1.10.1)
• Environment management: Conda (v23.3.1).
• Execution platform: macOS (local terminal and Jupyter Notebook).
• Workflow hygiene: Minimal outputs, modular scripts, reproducible paths.
The author gratefully acknowledges the guidance and valuable contributions of Dr. Hariram Chavan, whose mentorship and insights were instrumental in shaping the conceptual framework and scientific direction of this study. His encouragement and constructive feedback provided clarity in aligning computational outputs with biological interpretation, and his support was essential in refining the manuscript for translational relevance. We thank the investigators who generated and deposited the GSE41826 and GSE40279 DNA methylation datasets in public repositories, and the maintainers of the GENCODE‑based 450K manifest used for CpG annotation. We also acknowledge the developers of the open‑source software libraries used in this work. This manuscript reflects the authors’ original research, writing, and design efforts. AI tools were used sparingly to assist with polishing language and formatting visuals, but all scientific ideas, analyses, and interpretations were developed and validated by the authors.
This research was conducted independently without external financial support. No specific grant from any funding agency in the public, commercial, or not‑for‑profit sectors was received for this work.
The author declares that there are no conflicts of interest related to this study.
1. Suresh Ramchandra Kaulagi (Corresponding Author)
Conceived and designed the study; curated and harmonized methylation datasets (GSE40279, MethAgingDB); implemented slope filtering and genomic annotation; performed statistical analyses; developed enhancer and CpG island stratification; drafted and revised the manuscript; ensured reproducibility of the computational pipeline. The author was solely responsible for conceptualization, data analysis, pipeline development, visualization, and manuscript preparation.
2. Dr. Hariram Chavan
Provided supervision and guidance on study design and methodology, reviewed and refined the manuscript for scientific accuracy and clarity.
3. Aditya Kaulagi
Contributed expertise in artificial intelligence and machine learning; assisted in ensemble model development and optimization; validated outputs of regression and classification models; provided technical input on reproducibility and scalability of the computational framework; reviewed manuscript for clarity in AI/ML methodology
Funding
Self funded research - No external funding was received.
Conflicts of Interest
The authors declare no conflicts of interest.
Ethics Approval
Not applicable.
Data Availability
Public dataset GSE40279 (NCBI GEO).
Clinical Trial Registration
This study does not involve a clinical trial and hence trial registration details are not applicable.
Consent to Publish Declaration
Not applicable.
Consent to Participate Declaration
Not applicable.


 Abstract
 PDF
PDF