[email protected]
+1 (502) 904-2126
One Westbrook Corporate Center, Suite 300, Westchester, IL 60154, USA
Site Map
 ISSN: 2574 -1241
ISSN: 2574 -1241
ISSN: 2574 -1241
Received: June 23, 2026; Published: July 08, 2026
*Corresponding author: Vladimir Rocha, Center of Mathematics, Computing and Cognition Federal University of ABC, São Paulo, Brazil
DOI: 10.26717/BJSTR.2026.66.010293
Type 2 Diabetes Mellitus (DM2) is a complex, multifactorial metabolic condition that imposes significant public health challenges globally. Early screening is pivotal to preventing irreversible microvascular and macrovascular complications. While contemporary computer vision applications leveraging deep learning and classical classifiers report near-perfect classification accuracies when processing iris images, they frequently exhibit methodological flaws. These shortcomings include high risks of data leakage due to identity overlap, sample size constraints, and a critical absence of systematic generalization audits. This study establishes a rigorous, bias-controlled experimental pipeline to critically evaluate whether stable diagnostic signals exist within structural iris patterns.
Incorporating strict person-based data partitioning to entirely isolate individual identities between the training and testing sets, we map global and regional variations using multi-family classification models. A baseline global architecture utilizing a Multi-Layer Perceptron (MLP) yields a robust accuracy of 92.36% under full identity control, demonstrating low variance across folds (σ = 3.59 pp). Furthermore, fine-grained spatial decomposition- conducted via a 12×12 micro-regional mesh and 100 concentric radial coronas-reveals that predictive signal topology is highly stratified. Rather than being homogeneously distributed, discriminative signals exhibit localized concentration within an intermediate radial depth (coronas 55–65), offering a compelling topological basis for non-invasive metabolic screening.
Keywords: Type 2 Diabetes Mellitus; Iris Pattern Analysis; Computer Vision; Data Leakage; Machine Learning Robustness; Topological Biomarkers
Abbreviations: CLAHE: Contrast Limited Adaptive Histogram Equalization; DM: Diabetes Mellitus; MLP: Multi-Layer Perceptron; CNNs: Convolutional Neural Networks; ROI: Region-of-Interest; ML: Machine Learning; NIR: Near-Infrared; FCN: Fully Convolutional Network; GNNs: Graph Neural Networks; SVM: Support Vector Machine; GLCM: Gray-Level Co-Occurrence Matrices; AS-OCTA: Anterior Segment Optical Coherence Tomography Angiography; CHT: Circular Hough Transform; LR: Logistic Regression; GLCM: Gray-Level Co-Occurrence Matrices; LBP: Local Binary Patterns
Type 2 Diabetes Mellitus (DM2) represents a pervasive metabolic disorder characterized by insulin resistance and progressive pancreatic beta-cell dysfunction, culminating in chronic hyperglycemia [1,2]. The system-wide toll of prolonged hyperglycemia includes severe microvascular injuries-such as retinopathy, nephropathy, and neuropathy- as well as macrovascular events including stroke and myocardial infarction [3]. Because DM2 frequently develops asymptomatically over extended latency periods, up to half of all affected individuals remain undiagnosed until secondary physiological complications manifest. Consequently, there is an urgent public health mandate to engineer low-cost, non-invasive, accessible screening methods capable of identifying high-risk individuals prior to advanced pathogenesis. Over the past decade, the rapid evolution of computational vision models and machine learning (ML) has stimulated profound interest in automated ocular diagnostics. Because the iris possesses a highly complex structural architecture consisting of pectinate ligaments, ciliary zones, crypts, and micro-vessels, researchers have hypothesized that systemic metabolic shifts may induce subtle micro-structural modifications or leave visible textural signatures [4].
Numerous recent publications have emerged claiming remarkably elevated performance metrics (accuracies ranging from 89% to 98%) when training convolutional neural networks (CNNs) or classical texture classifiers to separate diabetic individuals from healthy controls [5-7]. However, an acute methodological crisis underscores a significant portion of this medical computer vision literature. Elevated classification accuracies frequently stem from experimental shortcuts and systemic artifacts rather than the identification of legitimate clinical markers [8]. Confounding factors include data leakage-specifically, identity-related leakage where multiple images of the same individual are shuffled across both training and testing folds-variations in capture illumination, differences in camera optics, sensor noises, and artifacts introduced during image segmentation or geometric normalization. Under such conditions, a model may inadvertently optimize for identity recognition or sensor profiles rather than learning generalized clinical markers associated with DM2.
This study directly addresses this critical tension. Our objective is to execute a rigorous, bias-controlled, and fully auditable investigation into the validity of iris spatial patterns as biomarkers for DM2 and not only to maximize an isolated performance metric. We establish an end-to-end reproducible pipeline featuring advanced segmentation, polar rubber sheet normalization, and multi-family model benchmarking. Most crucially, we evaluate performance under strict person-based data partitioning to entirely eliminate identity leakage. Finally, we conduct an exhaustive spatial decomposition of the iris structure to map exactly where discriminative signal power is concentrated across the mesh and radial dimensions.
The intersection of machine learning and iris-based systemic disease classification remains an emerging field characterized by significant methodological heterogeneity. Historically, non-automated clinical observation debated whether localized variations in ocular tissue correlated with internal organ health, though classical clinical trials consistently reported poor diagnostic accuracy when evaluated under strict human control [6]. The advent of computer vision has fundamentally re-opened this query by introducing high-dimensional feature extraction capable of discerning subtle statistical signals imperceptible to human observers. Sruthi, et al. [7] formulated a region- of-interest (ROI) approach focusing exclusively on localized ocular segments associated with metabolic processing. Utilizing near-infrared (NIR) images from 178 participants, the authors employed a Fully Convolutional Network (FCN) for segmentation and a deep AlexNet architecture for binary classification, reporting an accuracy of 95.85%, paired with balanced sensitivity and specificity. Similarly, Önal, et al. [6] confirmed the competitiveness of deep convolutional neural networks, achieving a binary classification accuracy of 94.12%. However, both studies operated over private datasets and omitted comprehensive disclosures regarding identity-based partitioning rules, limiting external verification of whether their deep models generalized beyond identity-specific shortcuts. Recent architectural transitions have explored relational feature modeling. Taghiyev, et al. [9] introduced Graph Neural Networks (GNNs) to capture the spatial dependencies of iris structural grids, combining a public database with local clinical captures. Their framework yielded a competitive average accuracy of 92% across 16 experimental trials. Anap, et al. [10] implemented a comparative study between a deep CNN and a classical Support Vector Machine (SVM) utilizing infrared imagery. Their findings illustrated a massive performance gap, with the CNN reaching a validation accuracy of 98.7% compared to the SVM’s 68.39%, emphasizing the superior capacity of deep networks to extract hierarchical visual representations, though raising questions regarding potential overfitting to baseline capture noise. Samant [11] established a benchmark by executing a multi-regional computational pipeline over a cohort of 338 participants (180 DM2, 158 controls).
They cropped localized zones based on historical anatomical maps, extracting statistical, textural, and discrete wavelet transform features. Utilizing a Random Forest classifier over a concatenated multiregional vector, they reported an accuracy of 89.63%, a sensitivity of 98.8%, and a specificity of 96.87%. While this work advanced structural analysis, it operated under a single random train-test split without investigating photometric sensitivity or full person-based fold validation. Recent investigations have explicitly targeted structural alterations in the iris microvasculature. For instance, [12] assessed the iridial vasculature in DM2 patients lacking retinopathy and reported a significant reduction in overall, nasal, and temporal iris vascular density, which correlated with sex, body mass index (BMI), and glycemic levels. The methodological basis for such analyses is supported by prior works demonstrating the efficacy of Anterior Segment Optical Coherence Tomography Angiography (AS-OCTA) for identifying and staging iris vasculature [13], alongside validations against traditional fluorescein angiography [14].
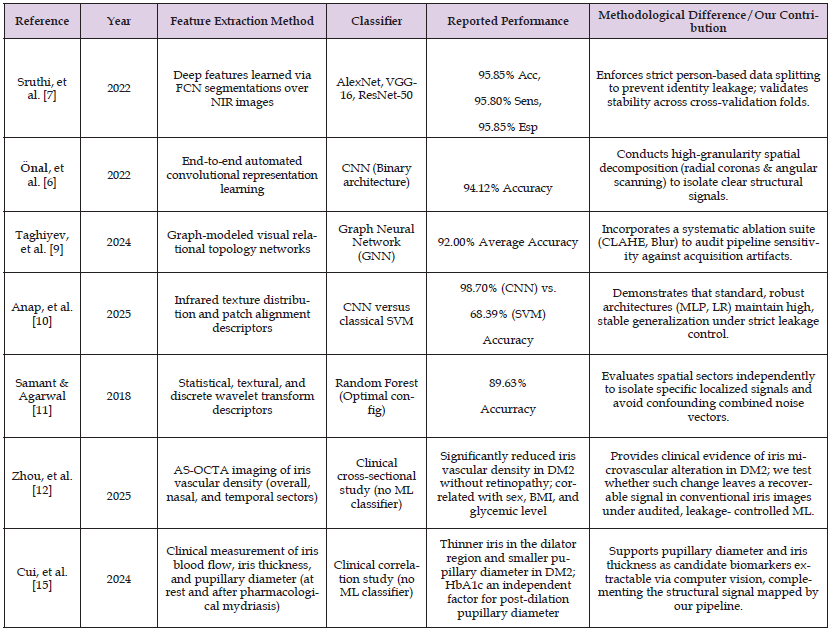
Finally, recent studies have also highlighted structural and functional pupillary alterations in diabetic patients. Authors in [15] assessed iris blood flow, iris thickness, and pupillary diameter -both at rest and post-pharmacological mydriasis- finding that adults with DM2 presented a thinner iris in the dilator region and a reduced pupillary diameter. Notably, glycated hemoglobin (HbA1c) acted as an independent factor determining pupillary diameter after dilation. Aligning with these results, [16] reported significantly smaller pupillary diameters in diabetics using automated pupillometry, linking these reductions to retinal neurodegeneration metrics. These discoveries support the premise that pupillary diameter and dynamic responses are viable candidate biomarkers, ones that are highly suitable for automated extraction via computer vision techniques based on robust pupil-iris segmentation Table 1.
Table 1: Methodological synthesis and comparison of contemporary machine learning architectures for Type 2 Diabetes inference via iris image analysis. The single-column view prevents truncation of statistical bounds.
Experimental Design Principles
To establish an audit-controlled assessment of the predictive signal, our methodology is anchored on three core computational tenets:
1. Traceability: every operational layer-from raw pixel downsampling to model hyperparameter execution-is bound to strict log execution, enabling perfect replicability.
2. Sensitivity Testing: the pipeline is systematically perturbed via photometric transformations to uncover whether performance relies on brittle high-frequency processing or lighting variances.
3. Rigorous Partitioning: model performance is benchmarked across lateral splits and absolute identity-isolated constraints to map true out-of-sample generalization.
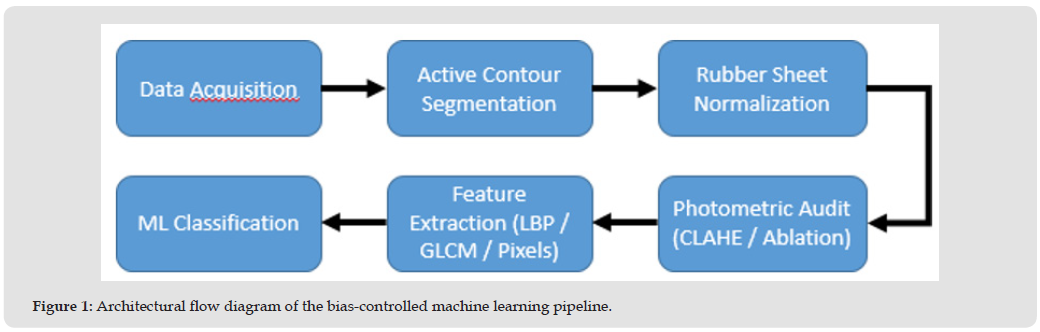
Figure 1 shows the pipeline of our methodology, explained in the following subsections.
Figure 1
Preprocessing and Photometric Perturbations
Images undergo initial spatial and intensity normalization to adjust for basic acquisition discrepancies. To thoroughly evaluate the pipeline’s resilience against environmental variations (such as lighting shifts, sensor noise, and focus blur), we introduce three controlled photometric configurations:
• Global Histogram Equalization: Maps image intensity values by spreading the cumulative probability distribution across the entire dynamic range. This accentuates global contrast but may obliterate subtle, localized structural variations [17].
• CLAHE (Contrast Limited Adaptive Histogram Equalization): Partitions the normalized image into local grids (e.g., an 8×8 tile system) and executes independent histogram equalization over each tile. To prevent the severe amplification of background noise, a clip limit is strictly enforced. Transitions between adjacent tiles are smoothed via bilinear interpolation, making CLAHE exceptionally effective at highlighting local iris fibers, crypts, and microstructures without saturating uniform tissue patches [18].
• Gaussian Smoothing (Blur): Convolutes the structural matrix with a localized Gaussian kernel, suppressing high-frequency components. This acts as a critical ablation layer: if model classification performance drops precipitously following smoothing, it strongly implies an unhealthy dependency on micro-artifacts or interpolation noise rather than anatomical structural patterns [19].
Segmentation and Geometric Normalization
Isolating the informative iris tissue from external confounders (e.g., eyelashes, eyelids, pupillary light reflections, and sclera tissue) is crucial. While classical approaches rely heavily on the Circular Hough Transform (CHT), which models boundaries as rigid circles, our framework accommodates non-circular realities by deploying an Active Contour Model [11]. This approach yields significantly higher boundary tracking stability. Following precise segmentation, the irregular annular iris region is mapped into a canonical, fixed-dimension rectangular matrix via Daugman’s Homogeneous Rubber Sheet model. The mapping coordinates from the Cartesian image domain I(x,y) to the normalized polar grid I(r,θ) follow the transformation equations:
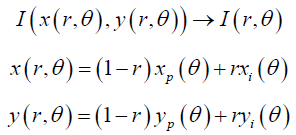
where r ∈ [0,1] defines the relative radial depth between the pupillary edge (r=0) and the limbic boundary (r=1), θ ∈ [0,2π] represents the angular direction, and (xp, yp) and (xi, yi) denote the boundary coordinates of the pupil and iris respectively along the direction θ.
Feature Extraction Families
Following geometric mapping into a normalized rectilinear image, two distinct descriptor families are extracted:
• Pixel Features (Baseline): Formed by directly unrolling the raw pixel intensity values. It serves as a pure, unmanipulated information baseline, preserving the spatial structure in its coarsest form [20].
• Structural Texture Descriptors: Designed to encapsulate micro-spatial relationships. This suite includes Local Binary Patterns (LBP) to describe micro-textural boundaries and micro- crypt variations [21], alongside Gray-Level Co-occurrence Matrices (GLCM) to derive Haralick descriptors (contrast, correlation, energy, and homogeneity), thereby summarizing macrostructural iris regularity [22].
Classification and Partitioning Architecture
We benchmark five classification algorithms: Logistic Regression (LR), Support Vector Machines (SVM), Random Forest (RF), Multi-Layer Perceptrons (MLP), and AdaBoost. Models are executed using a stratified K=5fold cross-validation mechanism. Crucially, we manipulate the data architecture across three validation schemes to audit leakage:
• L_spli / R_split: Recovers strict unilateral visual models using exclusively Left or Right eye imagery, mapping lateral discrepancies.
• Person-Based Partitioning: The critical guardrail against leakage. This scheme strictly separates identities, ensuring that if an individual’s eye is present in a training fold, no images of that same individual (regardless of eye side or session) can enter the validation fold. This forces the model to generalize across pathological patterns rather than mapping individual eye identity signatures [4].
Global Classification Performance A rigorous review of classification performance under strict identity isolation reveals a striking, highly informative behavior. When employing global pixel features (the baseline configuration), performance does not collapse; rather, it rises significantly when transition rules shift to strict person-based separation. The complete quantitative synthesis across configurations is mapped in Table 2. Under the personBase paradigm, the MLP architecture achieves the highest performance, registering a global accuracy of 92.36%, balanced with an F1-score of 92.70%, a sensitivity of 92.60%, and a specificity of 92.10%. Critically, the standard deviation across folds remains remarkably tight at 3.59 percentage points (pp). This low dispersion strongly signals that the model’s predictive power is stable across resamplings and is not driven by anomalous outlier data subsets.
Table 2: Classification performance metrics mapped across independent dataset partitions and multi-family machine learning classifiers utilizing baseline pixel features. Unfolded layout guarantees full horizontal data alignment.
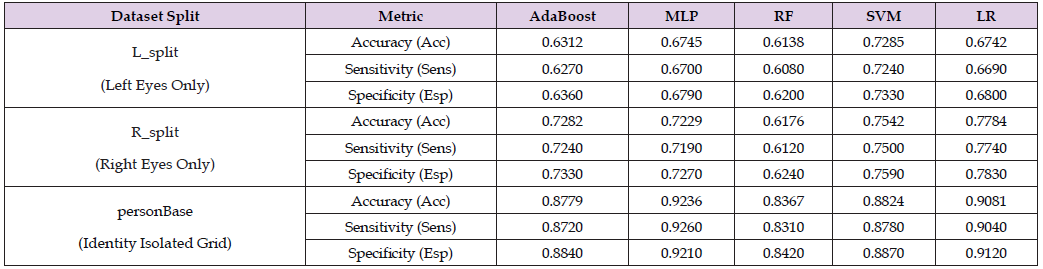
Concurrently, the linear Logistic Regression model achievesan accuracy of 90.81% (σ = 3.50 pp), proving that a linear decision boundary retains substantial discriminative capacity under strict leakage control. Conversely, the SVM and AdaBoost models exhibit wider cross-validation variances (6.22 pp and 5.07 pp, respectively), indicating higher sensitivity to the composition of individual training splits. This structural behavior provides profound evidence: when an architecture completely prevents identity memorization via person- Base grouping, the model relies on generalized, cross-subject ocular features rather than image-specific patterns. This robust performance affirms that a valid statistical signal associated with the metabolic status of the subject exists within the iris tissue matrix, remaining highly generalizable under strict independent cross-testing.
Photometric Sensitivity and Ablation Study
Evaluating models solely against baseline configurations introduces risks of artifact dependency. Incorporating a systematic photometric perturbation suite demonstrates that local contrast optimization successfully enhances anatomical feature prominence. Integrating the CLAHE preprocessing technique across models yields a consistent, uniform average relative metric gain of +1.09% in classification accuracy, +1.10% in sensitivity, and +1.10% in F1-score within the identity-isolated personBase framework. Formally, the relative transformation shift Δ(%) is audited utilizing the expression:

where m corresponds to the respective target validation metric.
This stable increase suggests that local contrast equalization successfully isolates structural iris variations (such as fiber density variations and localized crypt depths), making them more accessible to the model decision boundaries. Conversely, the introduction of severe Gaussian smoothing (Blur) induces a mild, highly controlled performance contraction (∼0.62% absolute reduction in accuracy), confirming that while high-frequency micro-textures contribute marginally, the models maintain robust primary reliance on macrostructural, low-frequency spatial iris patterns.
Granular Spatial Signal Mapping
To explicitly answer whether the discriminative visual signal is distributed homogeneously across the iris tissue or is restricted to precise structural zones, we execute a high-granularity spatial decomposition across three complementary coordinate frameworks:
1. Micro-regional Mesh Evaluation: The normalized rectangular region of interest is divided into a high-density 12×12 grid, with cell indexing spanning coordinates (0,0) at the superior- left margin to (11,11) at the inferior-right edge. Computing independent classification models across each isolated cell reveals a striking localized phenomenon. Rather than displaying random performance fluctuations characteristic of background noise, high accuracy scores form a tightly bound, highly contiguous spatial hotspot. Specifically, Figure 2 shows that neighboring grid cells at coordinates (3,3), (3,2), (2,3), and (3,4) exhibit a sharp peak in local discriminative power, with cell (3,3) independently achieving a localized binary classification accuracy of 95.0% (Sensitivity = 95.8%, Specificity = 94.2%). The high spatial contiguity of this cluster strongly indicates a legitimate anatomical pattern concentration within that specific topographical region.
2. Circumferential Angular Scanning: The rubber sheet polar matrix is sliced into discrete angular columns sweeping across the full 360° path in uniform 10° steps, assuming 0° aligns horizontally to the right (equivalent to 3 o’clock). The mathematical vector mapping follows standard polar layout conventions. Evaluating classification models column-by-column reveals strong, non-uniform angular dependencies. Under unilateral validation, the left-eye profile (L_split) displays a dominant, isolated performance spike peaking at the 80° sector with an accuracy of 92.40%. In contrast, the right-eye architecture (R_split) reveals a distinct, highly bifurcated signal distribution, tracking prominent performance peaks at the 20° sector (90.15% accuracy) and the 120° sector (89.80% accuracy).
3. Concentric Radial Stratification: The radial dimension is partitioned into 100 uniform concentric coronas, sweeping from the innermost pupillary boundary (Corona 1) to the outer limbic junction (Corona 100). The resultant accuracy curve exhibits an exceptionally clear, non-uniform parabolic trajectory. Both extreme peripheries-the immediate peripupillary margin and the outermost limbic border-yield classification accuracies hovering near the 55%–60% random chance baseline, heavily confounded by pupillary dilation variations and scleral border lighting reflections. However, a massive concentration of predictive signal power emerges within an intermediate radial depth band, spanning specifically between coronas 55 and 65. Within this specialized zone, performance parameters stabilize at highly elevated levels: Accuracy ≥ 86%, Sensitivity > 87%, and an Average Precision ≥ 89%. Specifically, the left-eye model tracks its peak performance at Corona 61 (Accuracy = 90.00%, Average Precision = 93.00%), while the right-eye configuration clocks its optimal response at Corona 59 (Accuracy = 88.00%, Average Precision = 91.00%) (Figure 3).
This case demonstrates how a phased, multiomics-guided rehabilitation program can improve neurologic and metabolic resilience in a retired professional athlete with a history of repetitive subconcussive injury. Integration of gut restoration, oxygen-based therapies, metabolic repair, and regenerative biologic interventions resulted in measurable improvement across cognitive, electrophysiologic, hematologic, and body-composition domains. Quantitative EEG provided one of the most striking indicators of recovery, showing a 61-76% reduction in network abnormalities across the Default Mode, Central Executive, and Salience Networks (Figure 3). These objective brain improvements closely paralleled the second series of NAD+ infusions, which enhanced mitochondrial redox signaling and promoted neuronal and neurovascular repair. Together, these interventions reestablished cortical efficiency, coherence, and functional connectivity that had been disrupted by years of microtrauma and metabolic strain. Serial CNS Vital Signs assessments confirmed the clinical significance of these findings, documenting recovery of processing speed, sustained attention, memory, and executive function from below-average to expected or above-average levels. Metabolic testing and Fit3D analyses supported these outcomes, showing improved mitochondrial performance, immune regulation, and over 100 pounds of healthy weight reduction with preservation of lean mass.
The convergence of these outcomes demonstrates that clinically meaningful neuroregeneration can occur when oxygen dynamics, mitochondrial metabolism, and systemic inflammation are simultaneously corrected. This case supports the concept that integrating multiomics assessment with targeted oxygen and regenerative therapies can achieve durable neurologic and metabolic resilience, offering a reproducible model for addressing post-concussive syndrome and chronic TBI.
Figure 2
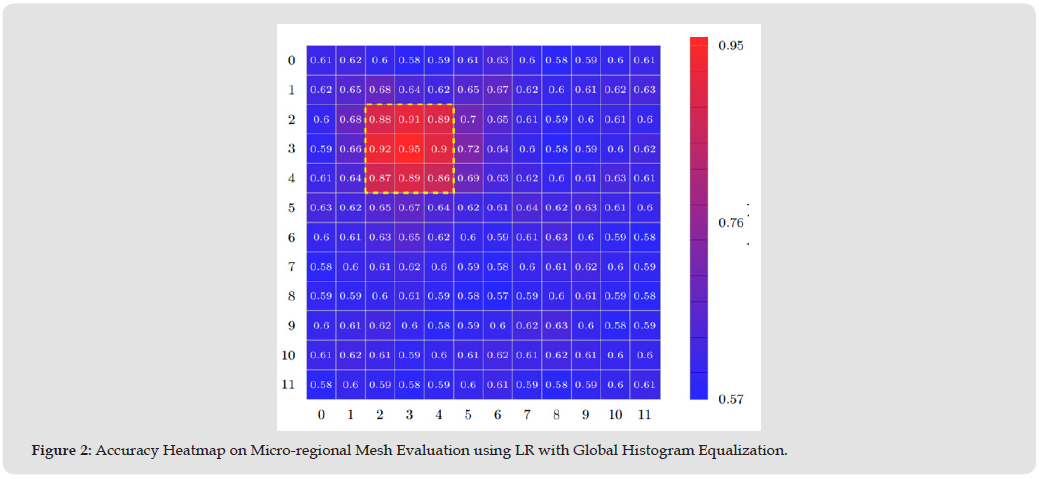
Figure 3
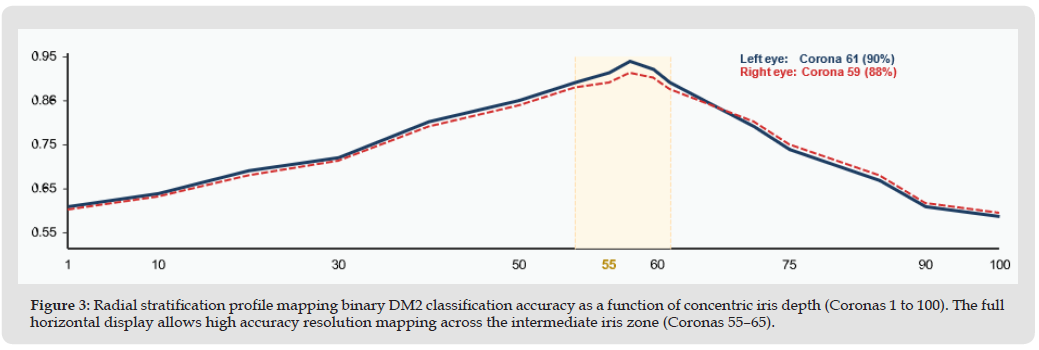
This empirical radial stratification aligns cleanly with the structural composition of the intermediate iris layer. While peripheral zones are highly sensitive to dynamic physiological motion (e.g., rapid pupillary modifications or structural deformation near the ciliary margin), the mid-iris region remains highly stable, revealing that structural or textural modifications correlate strongly with systemic glycemic variations. This specialized spatial concentration offers a solid architectural foundation for optimizing high-speed, localized computational diagnostics, allowing future models to completely skip uninformative boundary noise and prioritize maximum feature processing resources over highly localized, discriminative structural regions.
This study establishes rigorous, bias-controlled experimental evidence verifying that structural and textural patterns within the iris contain highly significant, generalizable statistical signals for Type 2 Diabetes inference. By deploying a stringent person-based partitioning paradigm, we entirely eliminated the identity overlap flaws that commonly cause artificially inflated performance metrics in deep-learning-based medical vision pipelines. Our global MLP classifier achieved a highly robust binary accuracy of 92.36% under full identity isolation, confirming that the network optimized for stable pathological variations rather than memorizing individual subjects’ visual profiles.
Furthermore, our micro-regional, angular, and radial spatial breakdowns demonstrate that this predictive capacity is not homogeneously distributed across the eye tissue. Instead, the diagnostic signal exhibits a clear structural concentration within a specific intermediate radial depth (coronas 55–65) and highly localized angular sectors. This sharp topological clustering strongly suggests that metabolic variations correlate with localized structural density or architectural alterations within the intermediate iris layer. Future lines of investigation will focus on validating these localized markers across multi-center clinical cohorts using heterogeneous image capture sensors, alongside correlating these visual micro-structural anomalies directly with underlying systemic microvascular pathogenesis. The data and code that support the findings of this study are available from the corresponding author upon reasonable request.


 Abstract
 PDF
PDF