[email protected]
+1 (502) 904-2126
One Westbrook Corporate Center, Suite 300, Westchester, IL 60154, USA
Site Map
Received: May 21, 2026; Published: June 03, 2026
*Corresponding author: Herbert Schneckenburger, Aalen University, Center for Applied Photonics, Beethovenstr. 1, 73430 Aalen, Germany
DOI: 10.26717/BJSTR.2026.65.010254
The present manuscript gives a short overview on Förster Resonance Energy Transfer (FRET) for measuring molecular distances in the nanometer range. The principle of this method is shown, and a historical overview is given, emphasizing the most important milestones. Subsequently some principal methods and applications of FRET are reported (with some emphasis on fluorescence lifetime imaging, FLIM), and finally a combination with various microscope techniques and innovative detection systems is described.
Keywords: FRET; Fluorescence Lifetime; Fluorescent Proteins; Light Microscop; Living Cells
Abbreviations: FRET: Förster Resonance Energy Transfer; FLIM: fluorescence Lifetime Imaging; GFP: Green Fluorescent Protein; EGFR: Epidermal Growth Factor Receptor; TIRFM: Total Internal Reflection Fluorescence Microscopy; APP: Amyloid Precursor Protein; LSM: Laser Scanning Microscopy; ECFP: Enhanced Cyan Fluorescent Protein; SPAD: Single-Photon Avalanche Diode; TCSPC: Time-Correlated Single-Photon Counting; EYFP: Enhanced Yellow Fluorescent Protein
Due to diffraction of light, resolution in Optical Microscopy is limited to about 200 nanometers (nm) according to the Abbe or Rayleigh criterion. Only recently some techniques of super-resolution microscopy permitted to circumvent this limit, when either structured illumination [1] or stimulated emission depletion [2] or single molecule localization [3,4] techniques were used. These techniques, however, need complex equipment and often require rather high light intensities and exposure times leading to phototoxic damages of living cells or organisms [5]. Therefore, as an alternative technique with low light exposure, Förster Resonance Energy Transfer (FRET) microscopy revealed to be useful for probing distances in the nanometer range. FRET is based on an interaction of optical transition dipoles of a so-called donor molecule and an acceptor molecule with a distance of about 10 nm or less between one another.
Non-radiative energy transfer from a donor to an acceptor molecule was described by Theodor Förster in 1948 [6]. It occurs upon optical excitation of a donor molecule and transfer of the excitation energy to an acceptor molecule, if both molecules are closer than about 10 nm. Based on the well-known formula for dipole-dipole interaction with an R-6 dependence on molecular distance [7,8], Förster established his theory resulting in the equation for the energy transfer rate
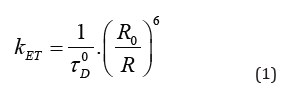
with the lifetime of the excited state of the donor τD 0, the molecular distance R and the Förster radius R0 containing information on dipole orientation as well as on the overlap of the emission spectrum of the donor and the absorption spectrum of the acceptor. Although non-radiative energy transfer from absorber (antenna) molecules to the reaction centre in photosynthetic organisms was already described in the early 1940s [9], the term “Förster Resonance Energy Transfer” (FRET) [10,11] was introduced only in the late 1970s. The principle of FRET is depicted in (Figure 1) with h νex corresponding to the energy of an absorbed photon and h νem to the energy of an emitted photon (acceptor fluorescence). During the first years after Förster’s death (in 1974) applications of his method were mainly restricted to physical chemistry. Some scientists proved his model with doped organic crystals upon variation of the distance, spectral characteristics or dipole orientation of donor and acceptor molecules (see e.g. [12]). First applications of non-radiative energy transfer to living cells [10] were reported from the 1970s up to the 1990s including cell membranes [13], cytoskeleton [14] and various organelles, e.g. mitochondria [15]. Furthermore, FRET was continuously applied to photosynthetic organisms, since energy transfer from chlorophyll antenna molecules to the reaction centers was very sensitive to their physiological state. For example, in needles of damaged spruces this energy transfer was reduced in comparison with healthy needles, and FRET revealed to be a valuable method for studies of the widespread phenomenon of forest decline in the 1980s and 1990s [16].
Figure 1

An important milestone for a broader application of FRET technologies was in the 1990s the introduction of Green Fluorescent Protein (GFP¸ naturally produced by the jellyfish Aequorea victoria [17]) and its variants for the blue, yellow and red spectral range. In addition to GFP, cyan (CFP), yellow (YFP) or red (RFP) fluorescent proteins could be fused with cellular proteins and permitted a site-specific tracking in living cells or even whole organisms. If a specific protein is fused with CFP and another protein with YFP, non-radiative energy transfer CFP → YFP can prove their proximity in the nanometer range. An example is shown in Figure 2, where the membrane associated Epidermal Growth Factor Receptor (EGFR, fused with CFP) and the Growth factor receptor-bound protein 2 (Grb2, fused with YFP) are in close proximity after stimulation by the epidermal growth factor EGF [18]. In general FRET between fused fluorescent proteins can be used for various pharmacological tests. A further milestone was the introduction of single-molecule FRET, which was concomitant with the development of ultra-sensitive cameras (e.g. electron-multiplying CCD cameras [19]) and selective measurement of thin cell layers using e.g. confocal or Total Internal Reflection Fluorescence Microscopy (TIRFM) [20]. An example is the interaction of amyloid precursor protein (APP) and β-secretase (BACE) in cell membranes, which plays a role in the pathogenesis of Alzheimer’s disease [21]. Also, for the example depicted in Figure 2 TIRFM techniques were successfully used. Fluorescence spectroscopy was often used for FRET applications. Donor and acceptor fluorescence were determined, and their ratio was calculated. However, their fluorescence quantum yields were often unknown, and an overlap of their emission spectra often made an evaluation difficult. Therefore, an evaluation of fluorescence lifetimes in the (sub)nanosecond range was easier for quantification of energy transfer, but required improved optical technologies. If a donor molecule is excited by a short (e.g. picosecond) light pulse, an excited state is created prior to a transition back to the ground state via fluorescence or a non-radiative transition. In case of energy transfer to an acceptor molecule the rate k of deactivation of the excited state of the donor is increased by the energy transfer rate kET, and the lifetime of the excited state of the donor (fluorescence lifetime) τ = 1/k is shortened. Therefore, if the fluorescence lifetime of the donor is measured in presence (τD) and in absence (τD0) of the acceptor, the energy transfer rate can be determined according to Equation 2.
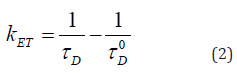
Figure 2

Thus, the use of fluorescence lifetime imaging (FLIM) represents a further milestone for FRET applications with techniques ranging from phase fluorometry [22] over fast camera technologies [23,24] up to laser scanning microscopy (LSM) with time-correlated single photon counting [25,26]. In the latter case whole information on fluorescence decay is given for each pixel of an LSM image, but requires sufficiently large data sets.
Use of various stationary or time-resolved techniques permitted a broad field of applications for measuring intermolecular as well as intramolecular FRET between various chromophoric groups of a large molecule (protein), where FRET may be sensitive to molecular configuration or specific location within a cell (see e.g. [18]). Furthermore, FRET is continuously combined with various microscope techniques, e.g. TIRFM or Light Sheet Microscopy [27] as well as with innovative screening devices [18]. Figure 3 shows a FRET based sensor for apoptosis with a cell membrane associated Enhanced Cyan Fluorescent Protein (ECFP) coupled to Enhanced Yellow Fluorescent Protein (EYFP) via the peptide linker DEVD. This linker is cleaved by the enzyme caspase-3 after the onset of apoptosis, and FRET from ECFP to EYFP is interrupted, as described in [28]. This causes disappearance of EYFP fluorescence and a prolongation of the fluorescence lifetime of ECFP from about 2 ns to 3.5 ns, as depicted in Figure 3. A further FRET application is related to the use of inorganic–organic hybrid nanoparticles (IOH-NPs) for treatment of H8N8 breast cancer cells [29]. When using the incorporated dye DUT647 (with an emission maximum around 670 nm), the fluorescence excitation of these nanoparticles was about 10 times more efficient at an excitation wavelength of 639 nm than at λex = 555 nm. However, when cells were co-incubated with LysoTracker Green, fluorescence intensities of the IOH-NPs were similar at excitation wavelengths of 555 nm and 639 nm and in a few cases even stronger at λex = 555 nm. While additional emission of the LysoTracker around 670 nm accounts very little for this stronger fluorescence, FRET from LysoTracker Green to the IOH-NPs might explain this phenomenon. FRET was further proven by a shortening of the fluorescence lifetime of LysoTracker Green from about 4.4 ns to 4.0 ns upon application of the nanoparticles, when an excitation wavelength of 470 nm was used. Since LysoTracker Green is mainly located within lysosomes, the FRET experiments prove lysosomal location also for the IOH-NPs and further suggest the LysoTracker to be used together with the IOH-NPs for enhanced fluorescence detection.
Figure 3

This paper gives an overview on FRET technologies and applications from the beginnings in 1948 up to present including the authors work. Time-resolved fluorescence techniques are emphasized, since they permit most quantitative data. Presently novel picosecond light sources, highly resolving microscopy and ultra-sensitive detection techniques are methods of choice. In this context light sheet microscopy combined with a single-photon avalanche diode (SPAD) array camera for fluorescence lifetime imaging (FLIM) with time-correlated single-photon counting (TCSPC) [30] should be mentioned.
The project on nanoparticles was funded by Carl Zeiss Stiftung within the call CZS Transfer 2024: Oberflächen. The authors thank H. Gröger and C. Feldmann (KIT Karlsruhe) for providing these IOHNPs. Thanks to my co-workers Sarah Bruns, Thomas Bruns, Steven Eckstein, Louisa Herbsleb, Claudia Hintze, Verena Richter Michael Wagner, Petra Weber as well as my colleague Andreas Walter for their cooperation in experimental projects.